
Agricultural Subsidies in 2012: What For, To Whom and Where Were They Allocated?

How were the MDL 400 million from the Fund for Subsidising Agricultural Producers allocated in 2012? Which districts received the most subsidies both in 2012 and over the last six years? The infographic shows that the geographical distribution of subsidies is uneven. In 2012, the top three regions with the largest volume of subsidies (in absolute terms) were: Briceni district (MDL 22.2 million), the Autonomous Territorial Unit of Gagauzia (MDL 20.3 million) and Anenii Noi district (MDL 20.0 million). Compared with the 2006-2011 period, Bălți, Dondușeni and Ocnița were at the top of the ranking for agricultural subsidy allocations. Nisporeni, Călărași and Hâncești districts received the lowest volume of subsidies from the Subsidy Fund over the last six years. Even though 68% of the total agricultural output is produced by peasant farms and household plots, they receive only 25.5% of the subsidies. The remaining 74.5% of the Fund is allocated to agricultural enterprises (LLC, JSC, CC, AC, PC) which generate only 32% of the total agricultural output. The infographic also describes the subsidy priorities and the areas of greatest interest for subsidised farmers. 1. The data were collected. See the data sources here. 2. The datasets were analysed. To be able to answer the questions, we analysed the data on how much money was allocated from the Fund for Subsidising Agricultural Producers in 2012, based on the lists of beneficiaries provided by the Agency for Interventions and Payments in Agriculture. 3. We identified the answers to be represented in this infographic. 4. We sketched the graphic representation. The final task was to present this information in a visual and comprehensible manner, allowing you to discover more about who the main beneficiaries were and what the money from the Fund for Subsidising Agricultural Producers is given for, as well as the situation compared with other European countries. See the editable graphic sources here. 5. We published the infographic “Agricultural Subsidies in 2012: What For, To Whom and Where Were They Allocated?”. The result is a graphic representation of this subject, divided into 7 themes, in which we described the general picture of agricultural subsidisation in the Republic of Moldova. For interested parties, we have published the datasets so that the analysis can continue. This is only a beginning for discussions on agricultural subsidies. We encourage journalists, NGOs and other interested parties to download the archive with the dataset and the graphic materials in order to continue working with these open datasets. All content on BudgetStories.md is licensed under the Creative Commons Attribution (Unported) v3.0 License. The use of the materials for creating your own articles is encouraged. Data collection and analysis: Tatiana Savva
Other infographics & videographics
 Infographic
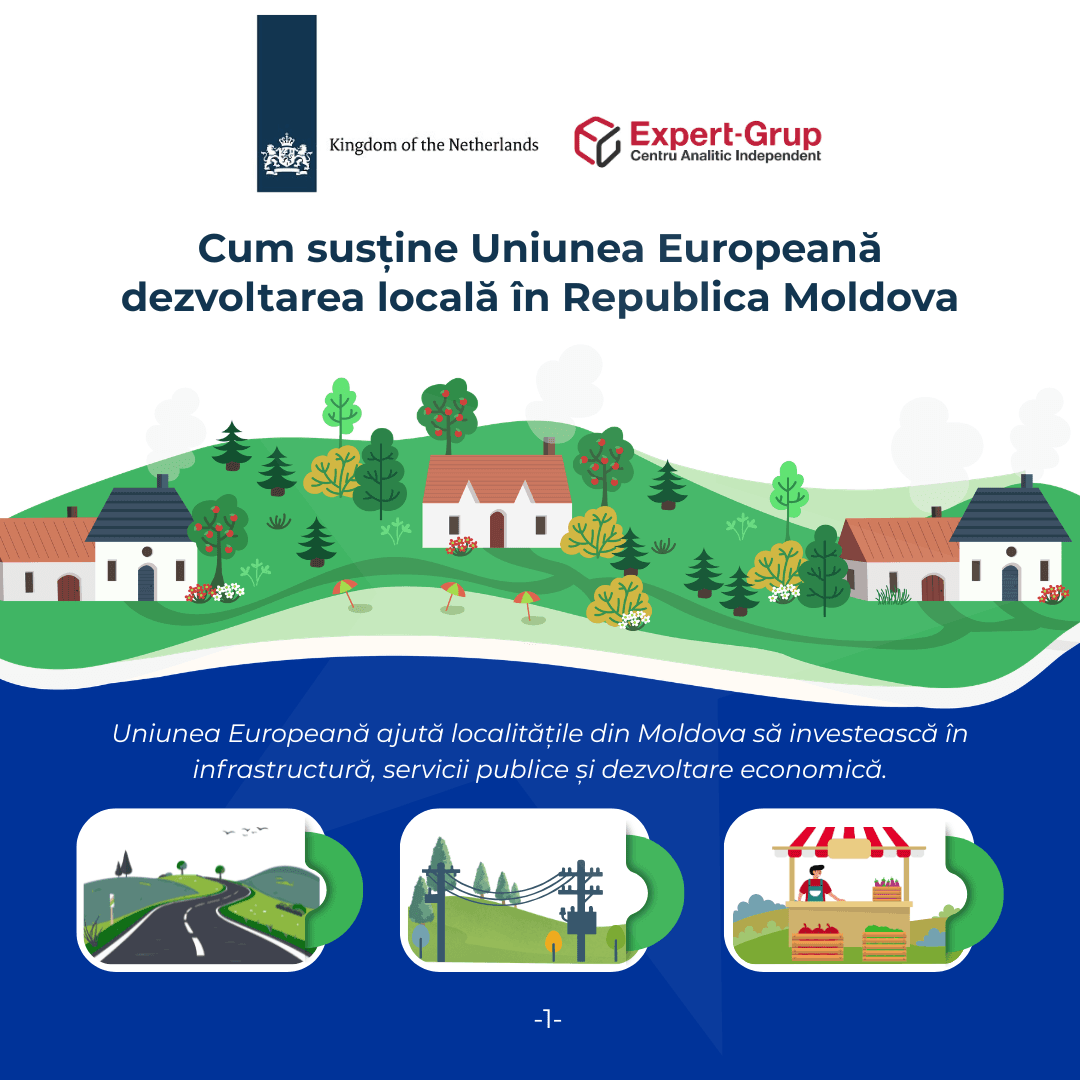
How the European Union Supports Local Development in the Republic of Moldova
21 July 2026
 Infographic
What should the next Government do to relaunch the economy?
8 July 2026
 Infographic
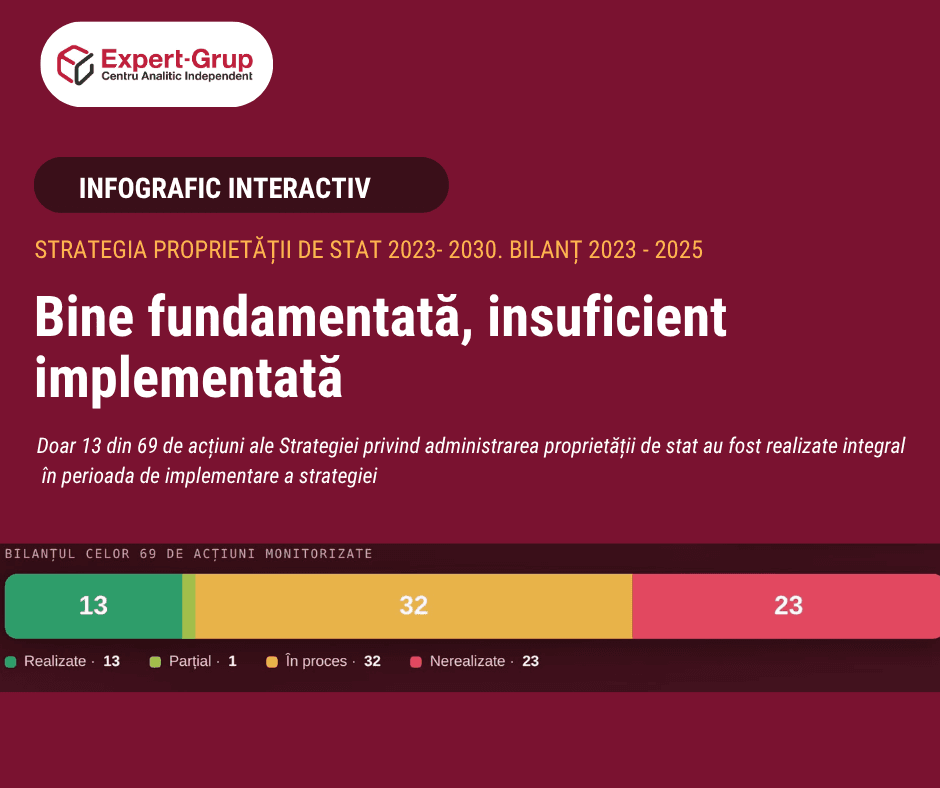
Monitoring the Implementation of the State Property Management Strategy in the Field of State-Owned Enterprises and Joint-Stock Companies
6 July 2026
 Infographic
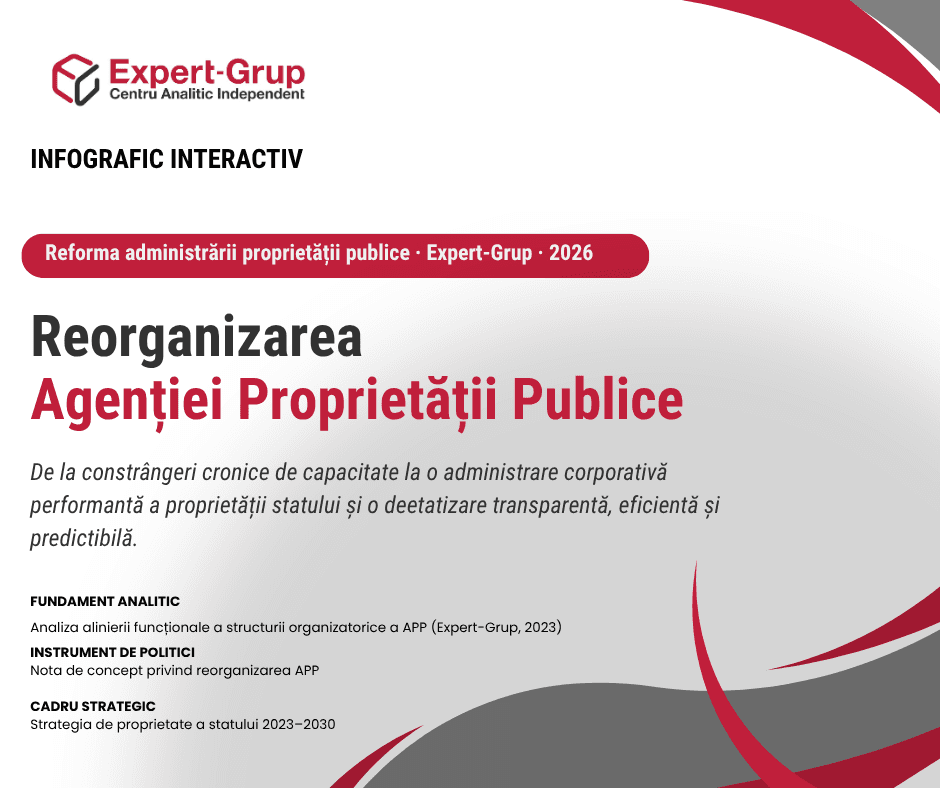
How Should We Reorganise the Public Property Agency?
29 June 2026