Moldova Economic Thermometer: The Economy Remains on a Growth Path, but Momentum Cooled in July; Q2 GDP Confirmed the Direction Signalled, but Not the Magnitude
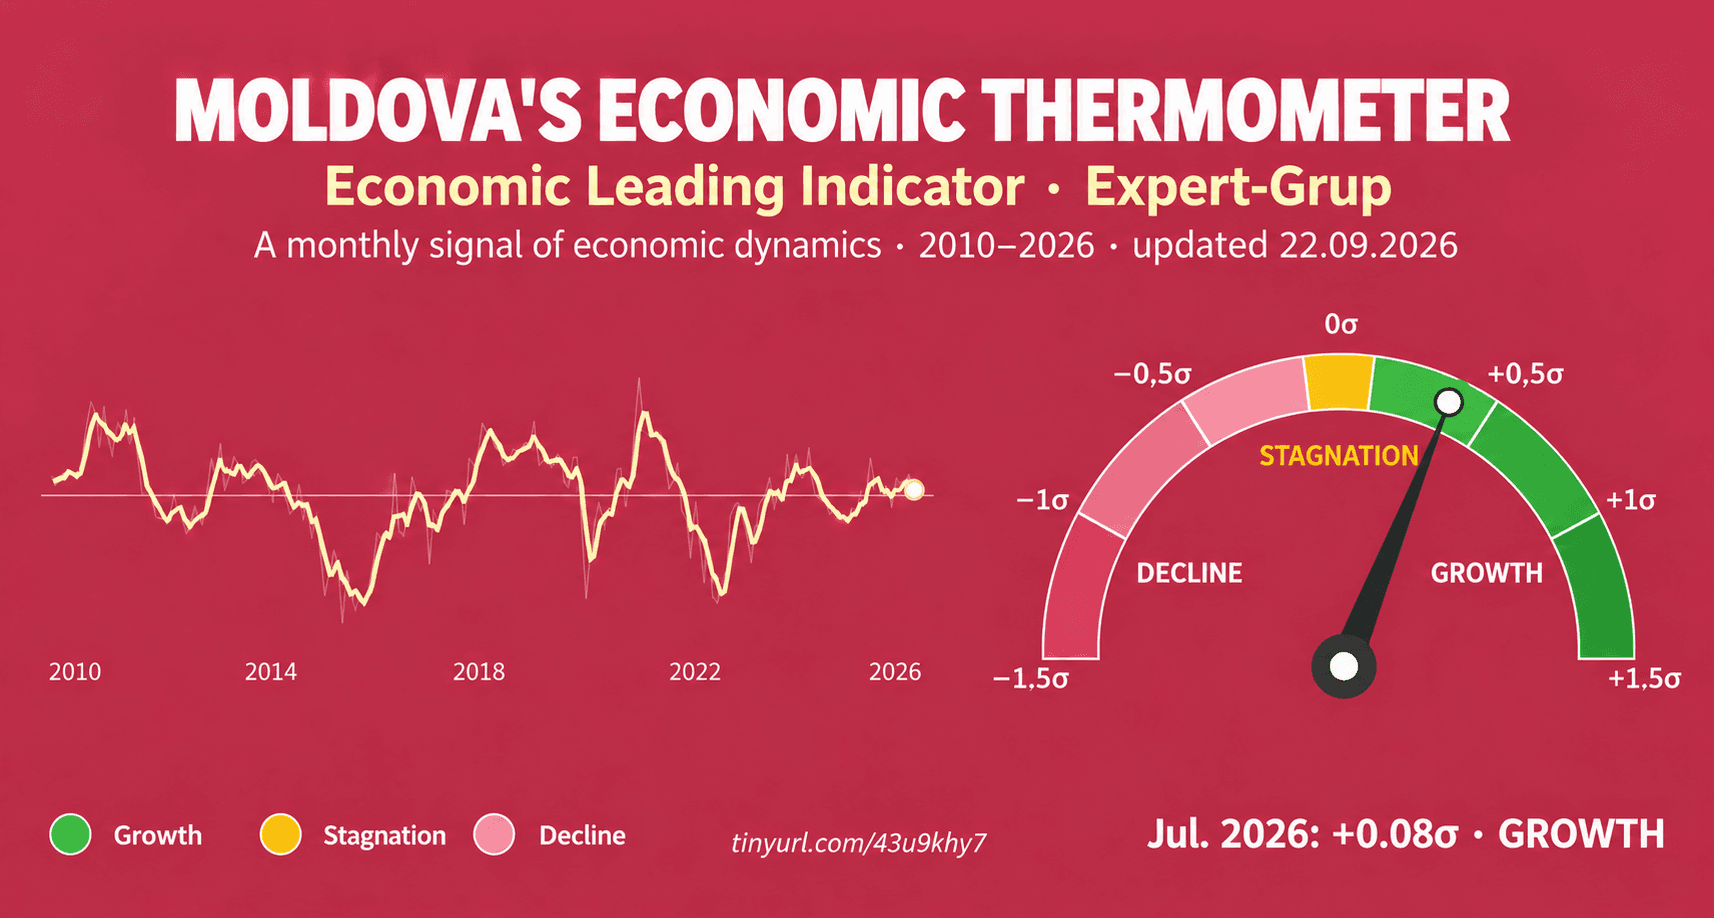
July reading: growth, at reduced speed
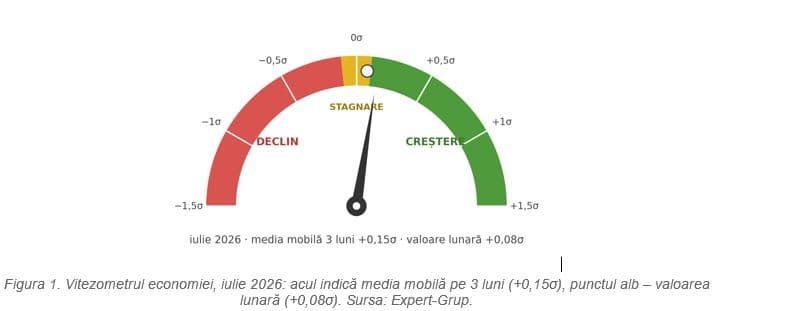
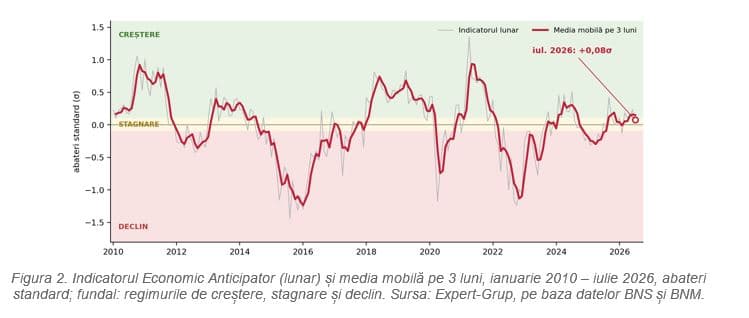
The economy's speedometer remains in the green zone, but the needle has moved closer to the stagnation zone. The indicator's monthly value fell from +0.23σ in June to +0.08σ in July, its weakest level since February, while the 3-month moving average – the benchmark that determines the regime – held at +0.15σ, above the +0.1σ threshold of the growth regime. For the second quarter as a whole, the indicator stood at +0.16σ, the first quarterly growth signal after two quarters of stagnation.
The engines of growth and the brakes
Support continues to come from the real economy. Retail trade grew by 9.0% in real terms compared with July 2025, industrial output by 7.1% (after +10.6% in June), and the M3 money supply by 6.6% in real terms. Goods exports, however, slowed sharply to +5.2% year on year (in USD), from +18.7% in June, largely owing to the high comparison base of July 2025.
The financial components remained in negative territory and together subtracted about 0.14σ from the indicator's value. The non-performing loan ratio held at 5.23% in July and rose to 5.51% in August, 0.28 percentage points above its level a year earlier. The spread between the 364-day government securities (VMS) yield (about 10.1%) and the base rate widened to 3.1 percentage points in July and narrowed to 2.6 percentage points in August, after the base rate was raised to 7.5%. Monetary tightening then accelerated: on 17 September the National Bank of Moldova raised the base rate by 1.5 percentage points, to 9.0%, as annual inflation climbed to 6.96% in August, above the upper bound of the target range. The three components already available for August (M3, NPL, spread) together make a negative contribution of about 0.11σ.
The Q2 test: the direction was right, the magnitude was not
GDP grew by 0.9% compared with the second quarter of 2025, after +0.4% in the first quarter, and in the seasonally adjusted series the economy recovered 1.4% quarter on quarter, after the 1.1% contraction in Q1. The quarterly indicator, at +0.16σ, was equivalent by calibration to growth of about 4%; the gap of 3 percentage points is comparable to the typical error of the relationship with GDP since 2011 (a median deviation of 2.5 percentage points).
The explanation is structural. The indicator's components correctly captured industry (value added in manufacturing +6.7%), exports (+13.6% in volume) and trade, but missed the contraction in information and communications (−7.9%), construction (−7.5%) and education (−5.3%), which cut GDP growth by 1.5 percentage points, as well as the rise in imports (+4.7%), which absorbed a further 2.9 percentage points. Sectors without monthly statistics remain the main source of deviations of the indicator from GDP, as also happened in the agricultural shock years of 2012 and 2022.
Outlook
For the second half of the year, the July moderation and the increase in the base rate to 9% point to modest growth. After +0.6% in the first half, the summer pace is consistent with annual growth of 1–2% in 2026, below the potential of about 3%. The full effect of the new base rate will be visible in the coming months, through the cost of credit and the yields on government securities, and the next update of the indicator, in mid-October, will include complete data for August.
“The economy entered the second half of the year with weaker momentum than in the spring. Industry, trade and exports support growth, but services, construction and the higher cost of money are holding it back. Without a visible acceleration in the autumn, 2026 will end with growth of 1–2%, below the economy's potential” – Adrian Lupușor, Executive Director, Expert-Grup.
Access via the link the Expert-Grup Indicator – Economic Thermometer of Moldova: https://adrianlupusor-cmyk.github.io/econ/
About the Economic Thermometer of Moldova
The Expert-Grup Leading Economic Indicator synthesises, in a single monthly signal, six indicators published by the NBS and the National Bank of Moldova: industrial output, retail trade (in real terms), goods exports, the M3 money supply (in real terms), the non-performing loan ratio and the spread between the 364-day government securities (VMS) yield and the National Bank of Moldova base rate. Each component is expressed in standard deviations from the average dynamics of the 2010–2026 period and enters with equal weight (1/6).
The indicator classifies the state of the economy into three regimes – growth (above +0.1σ, equivalent to GDP growth of more than about 3.6%), stagnation (−0.1…+0.1σ) and decline (below −0.1σ, below about 2.1%) – and is available 1–2 quarters ahead of official GDP statistics. The correlation with GDP growth is 0.61 (0.48 with a one-quarter lead), and 11 of the 15 recession quarters in 2011–2026 were accompanied by negative values of the indicator. The methodology follows the practices of the OECD (CLI), the Conference Board (LEI), the European Commission (ESI) and the Bank of Italy. The interactive dashboard, with monthly updated charts and a breakdown by component: https://tinyurl.com/43u9khy7
About Expert-Grup
The Independent Think Tank Expert-Grup is a think tank from the Republic of Moldova specialising in economic research and public policy. The Economic Thermometer of Moldova is updated monthly, as BNS and National Bank of Moldova data are published.
Contact person: Inga Agachi, Communications Manager, Expert-Grup, inga@expert-grup.org
Data sources: BNS – statbank.statistica.md (IND013100, COM013050, EXT015000, PRE012600) and the press release “Gross Domestic Product in the second quarter and first half of 2026” (14.09.2026); National Bank of Moldova – Interactive database (DPMC11, DRSB1, DOP5, DPMC2) and the Monetary Policy Decision of 17.09.2026.
Other articles in the same category
See all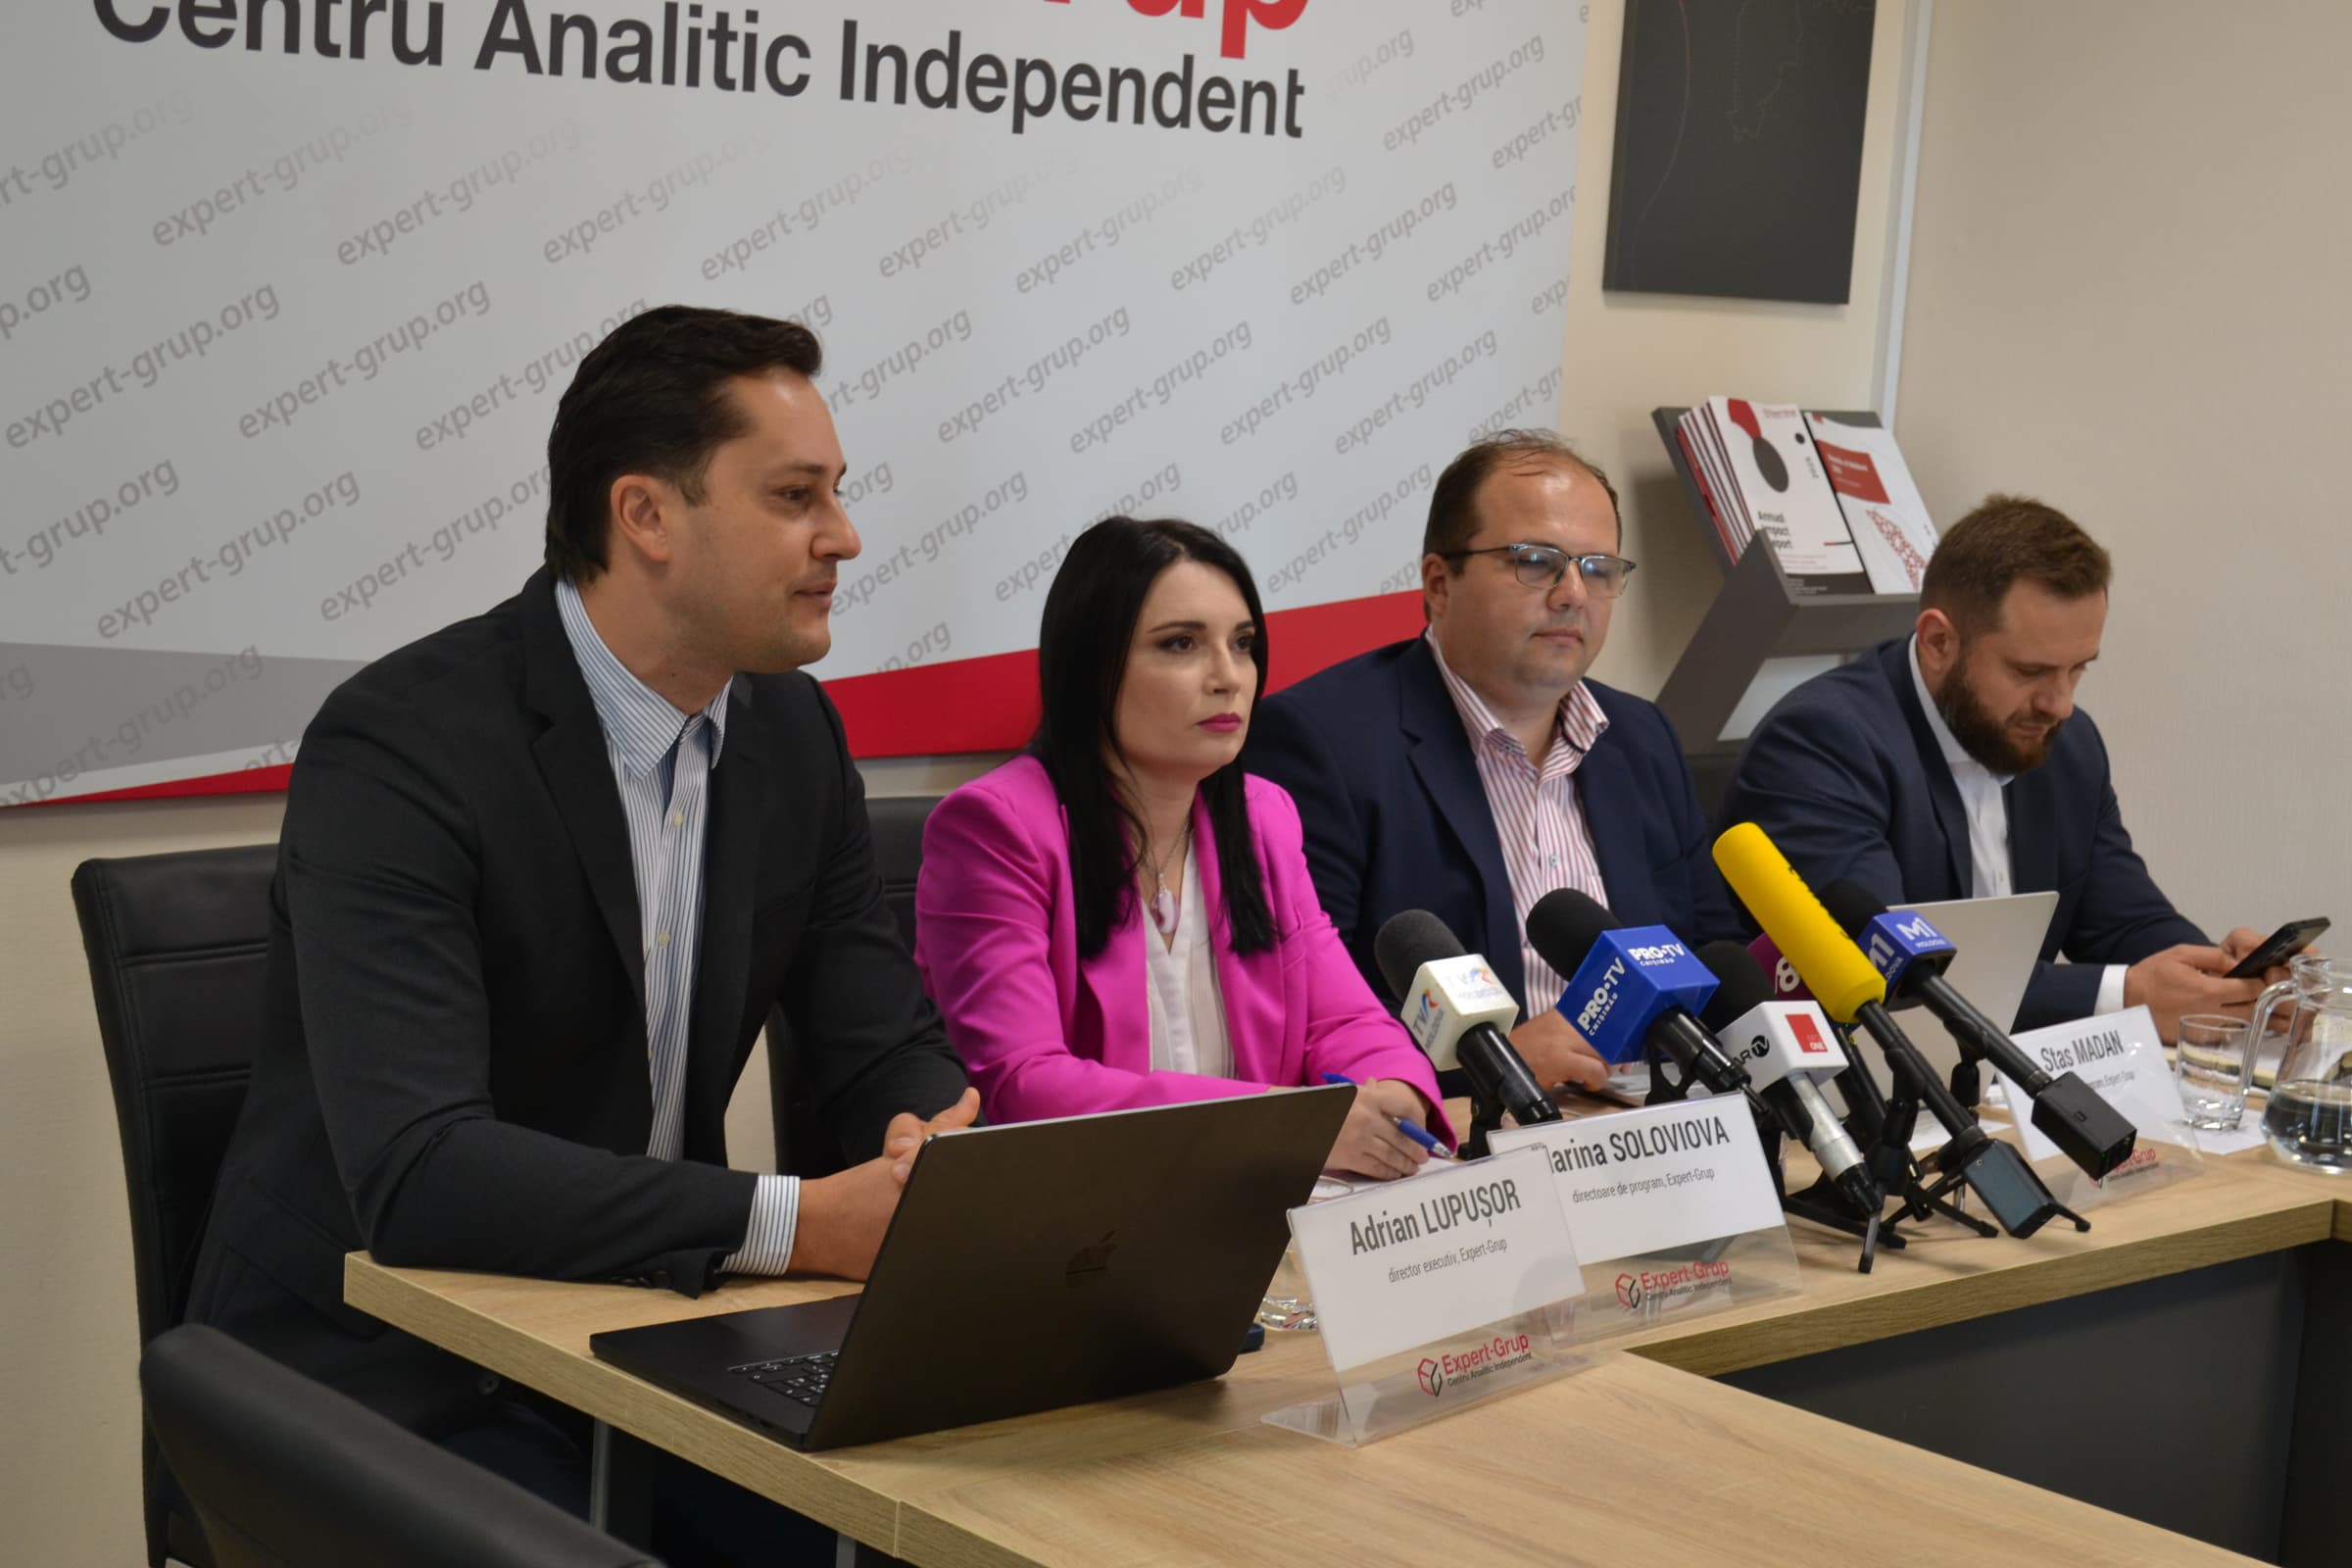
Expert-Grup launches monthly press conference series on the state of the economy: growth, inflation and energy challenges at the centre of the first edition

Expert-Grup launches “Economic Reality Analysed by Expert-Grup”, a monthly press conference series on the state of the economy
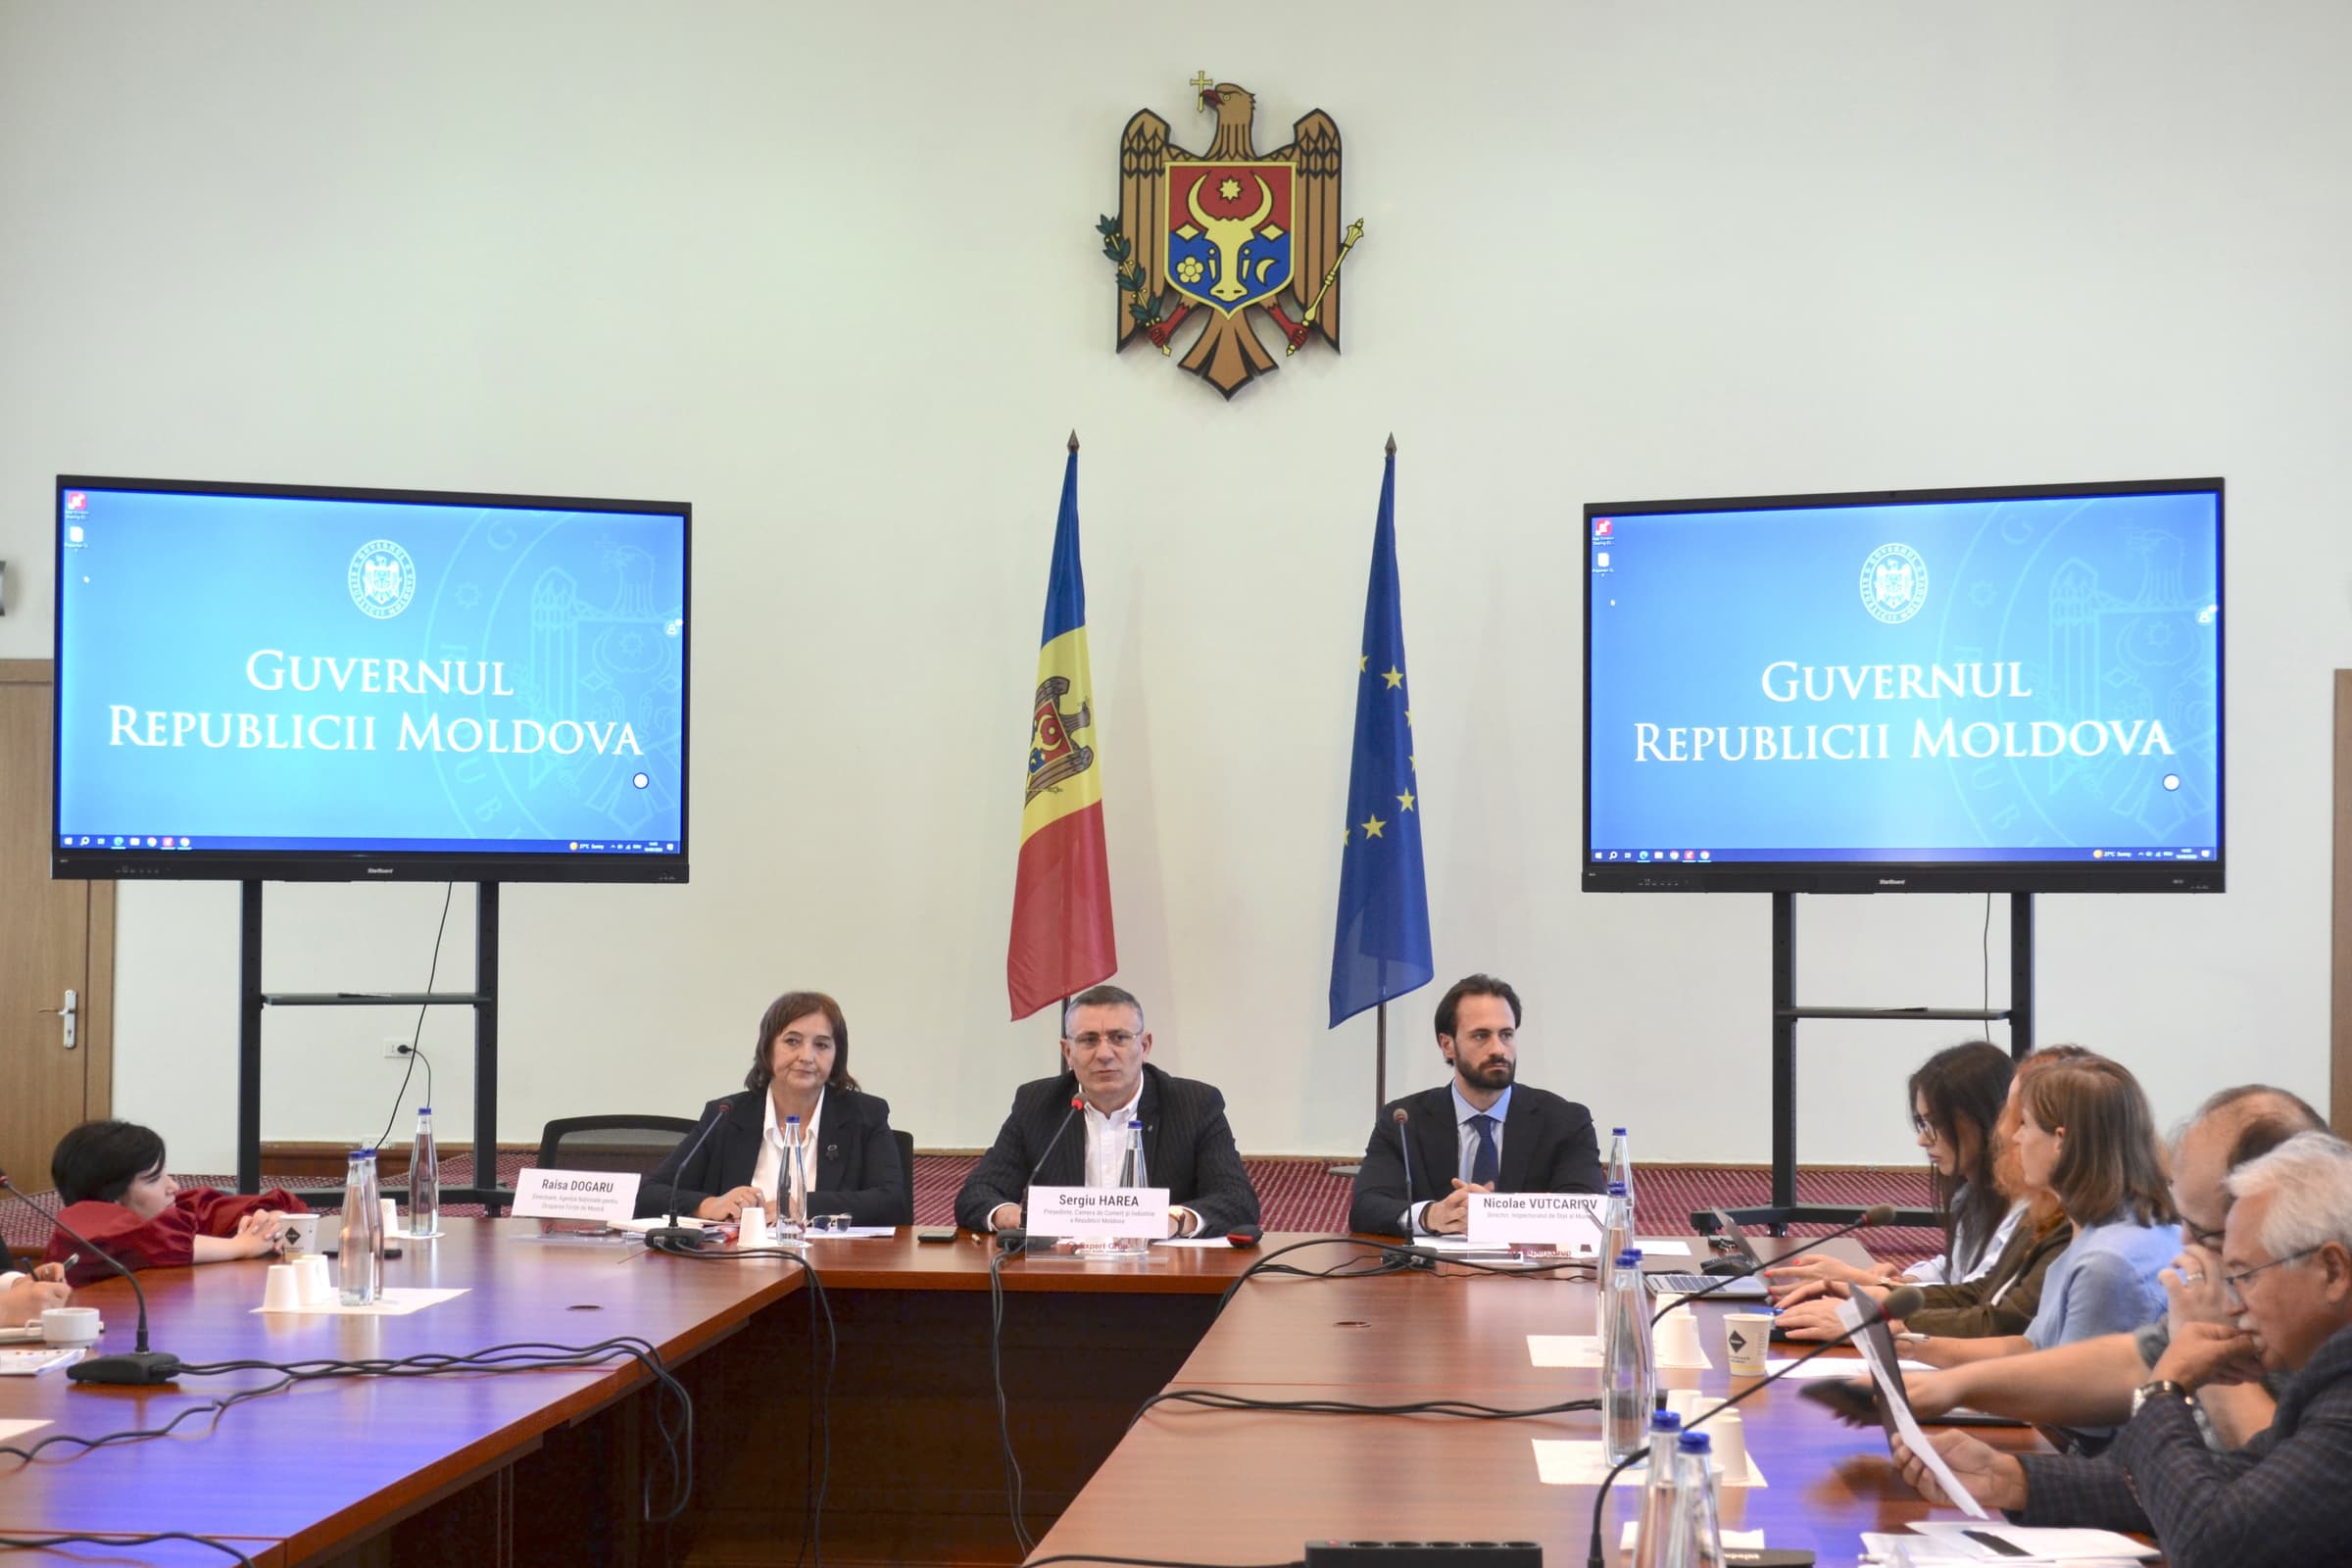
Results of the State Labour Inspectorate and the National Employment Agency, and New Solutions for Boosting the Labour Market Integration of Persons with Disabilities, Discussed at CONSECON